
After significant BTC sales since January, whales are accumulating again. Traders expect the Bitcoin price to rise.
Whales and small fish resume Bitcoin accumulation. Whales, those bitcoin holders managing between ₿1,000 and ₿10,000, who had started selling when the price exceeded $30,000, have changed strategy and started accumulating. The conclusion is presented in Ecoinometric’s latest report, “On-chain Trends,” published this Monday, July 12.
The report studied the behavior, since November 2020, of seven segments of holders, from those with less than 1₿ to whales. “The post-halving bull market began in October. It started when the price started to take off from the $10,000 price zone,” Ecoinometrics says. The paper highlights a noticeable difference between the behaviors of Bitcoin held by so-called fish (range below 1₿) and whales.
The following graph depicts the change in BTC held by the five segments mentioned since October 2020. Groups of less than 1₿, 1 to ₿10, and 10 to 100₿ on the left. The large holders, from 100 to 1,000 ₿, and whales (₿1,000 to ₿10,000 ) are on the right side.
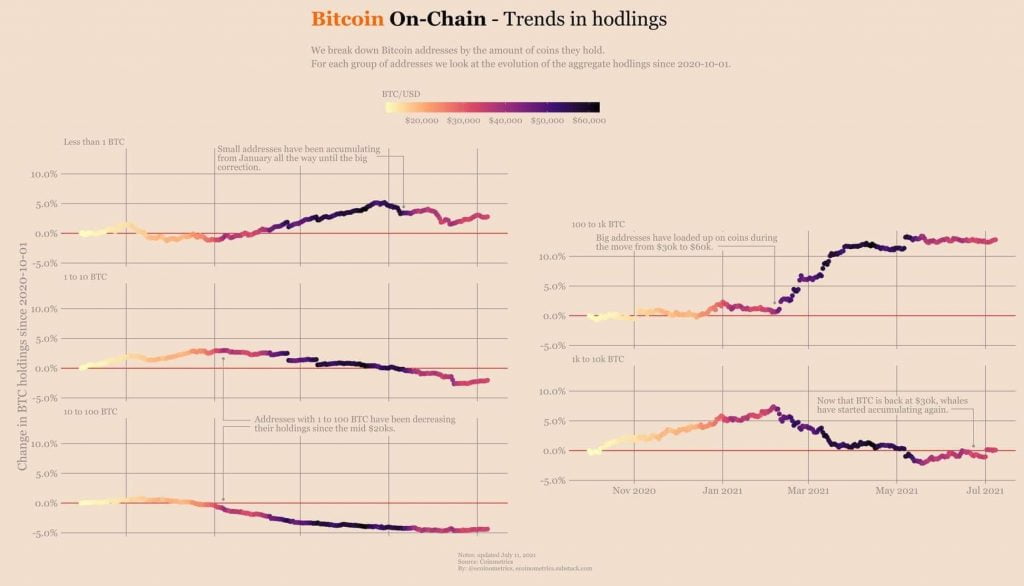
The graph shows that addresses of less than 1₿ accumulated Bitcoin until the mid-April drop. The following two groups, between 1 ₿ and ₿100, have decreased since the year started.
The group that has acquired Bitcoin with the most significant determination are the wallets holding between ₿100 and ₿1,000, especially when the price went from $30,000 to $60,000. According to the chart, these holders have held their funds in Bitcoin in the last two months.
Bitcoin from whale-controlled addresses began to decline in February, most likely due to profit-taking. However, after the Bitcoin price returned to $30,000, the report notes a revival of accumulation in this segment of large holders. Profit-taking ended in the five groups analyzed.
Growth patterns in Bitcoin cycles.
In several studies, Ecoinometrics has compared bitcoin price growth patterns after each halving. In mid-May, the analytics firm held the thesis that the bitcoin price would remain between the growth curves following the first and second bitcoin halving. At that time, the BTC price was still above $50,000 and headed for a new all-time high.
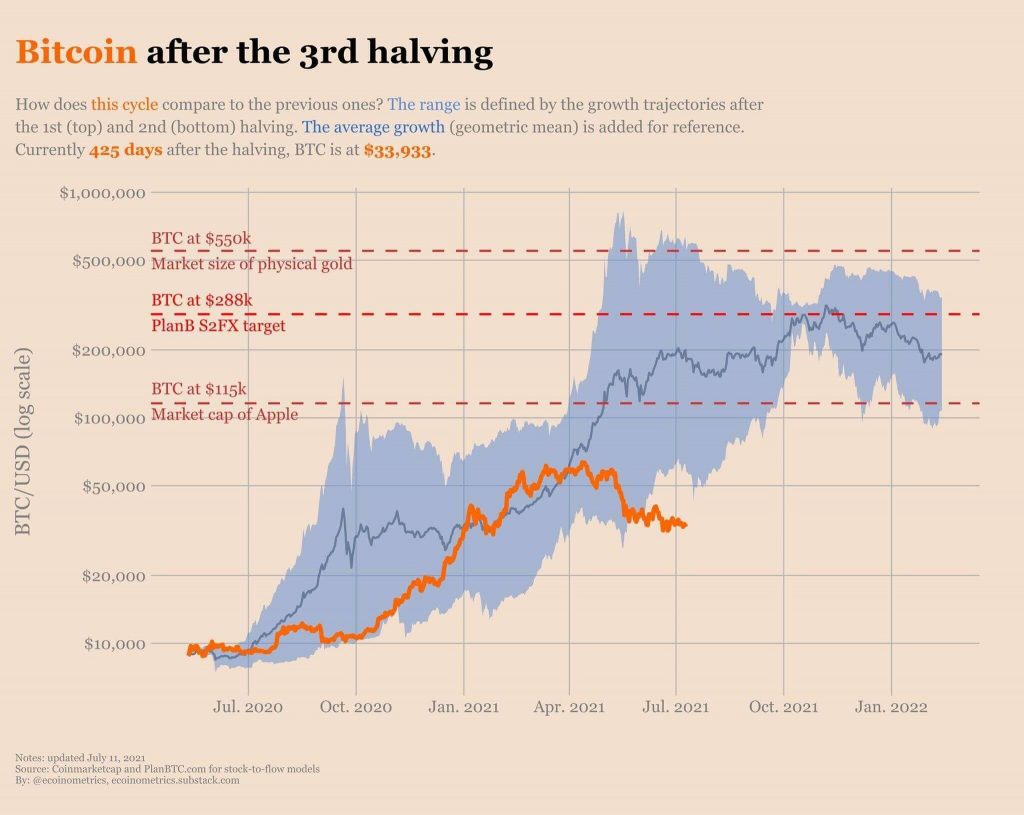
After the selling pressure led to a pullback in the bitcoin price in mid-April, the price trajectory moved below the growth band of the first two halvings. To find the reasons for the April correction, one would have to go to the beginning of the year, the report notes. Through a more detailed analysis of the whale’s behavior, Ecoinometrics states that when the price surged towards $40,000, those large holders considered the Bitcoin’s rally significant and happened very fast, leading the whales to start selling Bitcoin, according to the report.
Therefore, it is possible that some whales felt that [the rally] was too fast, and that led to some selling pressure that drove the hedging process to $64,000. When investors add fear, uncertainty, and doubt (FUD) to the situation, the small investors also stopped buying and holding, resulting in the -55% correction we are in now. Ecoinometrics.
However, the study states that the picture has changed since the BTC price stabilized in the $30,000 range. “Whales and small fish have started accumulating again, while other categories have turned neutral.”
As posited in the study, this early evidence of a resumption of accumulation would make a return to Bitcoin price surge possible. Glassnode’s most recent bitcoin market analysis, it states a net outflow from exchanges of ₿2,000 per day, supported by on-chain data, making the finding consistent with the results of the Ecoinometrics study.