
Contents
The SOPR indicator signals that we are in a typical stage before the start of a bullish trend. Bitcoin outperformed gold and equities in 2022.
In Short
- SOPR shows that the average BTC sales are currently profitable.
- This picture is typical of a bull market if sustained over time.
- Bitcoin’s compound annual growth over three years was 36% in 2022, outperforming gold.
What to expect from Bitcoin? A technical analysis metric estimates that bitcoin (BTC) could be close to initiating a bullish rally, higher than the increase it has made this year. We’re talking about the SOPR (spent output profit ratio) indicator. It measures the variation between the buying and selling prices of the currencies that move in the blockchain and tend to estimate possible future movements.
On the one hand, when the SOPR is greater than one, it indicates that, on average, people are selling bitcoin at a profit. On the other hand, when the SOPR is less than 1, it shows that investors, on average, are selling at a loss. The latter prevailed in last year’s bear market, but it has changed.
The SOPR is currently above one and at its highest level since November 2021, according to on-chain data from Whalemap.
Now, we are in a situation where SOPR is as high as it’s been since November 2021
— whalemap (@whale_map) February 7, 2023
BUT it is finally above 1.
If it stays this way, it could mean that #Bitcoin is finally converting to a bull market.
Let’s see how it goes. pic.twitter.com/5dwHToOj11
According to Whalemap, this metric rarely rises above 1 in a bear market, while in bull markets, it rarely falls below 1. Therefore, he cautions that we must continue to see how it performs.
Long-term SOPR projects an uptrend
In addition to the above metric, another metric that follows from this one, called the “SOPR ratio,” also projects the possible start of an uptrend, according to CryptoQuant. This indicator differs from the former because it calculates the value of long-term investors over short-term investors.
“Data from this indicator now suggests that bitcoin is poised to enter the new bullish ladder, despite the US Federal Reserve chairman’s insistence that interest rates must continue to rise to contain inflation.”
CryptoQuant
Likewise, market analysts also foresee a return to an uptrend, although not all agree. Some economists argue that the markets and the economy need to recover from predicting the rise of bitcoin.
Bitcoin outperforms gold and equities
According to Ark Invest research, Bitcoin’s annual growth rate outperforms gold and stocks over the last 3-5 years. Despite the bear market that has affected bitcoin’s price for more than a year, its performance has outperformed assets such as gold and equities when considering 3-5 year periods. The conclusion comes from the Big Ideas 2023 report, published on 31 January by investment management firm Ark Invest.
In conjunction with bitcoin’s average annual returns, the report employs the so-called compound bitcoin growth rate (CAGR) over 3, 4, and 5-year periods. “Despite bitcoin’s major price corrections being greater than 75%, bitcoin has delivered positive annualized returns over 3-, 4- and 5-year periods,” the report said.
CAGR is a number that represents the rate at which an investment would have grown if it had the same appreciation each year, with profits reinvested at the end of each period. Traders and investors use it to compare the returns of different assets. The chart of bitcoin’s 3-, 4- and 5-year CAGRs shows the compounded growths of several asset classes in contrast to bitcoin: global equities, debt bonds, and gold.
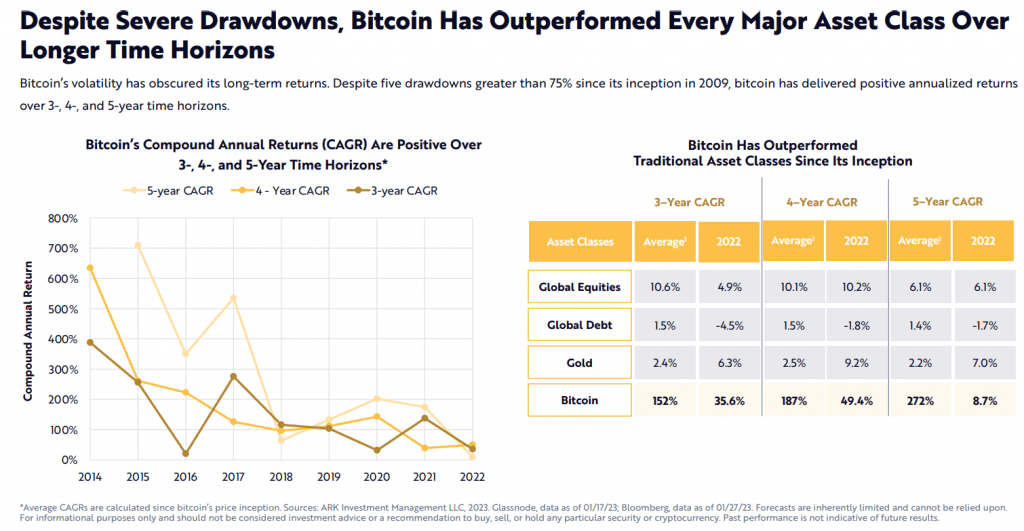
Over the last three years, bitcoin has shown an average yearly return of 152%. On the other hand, global debt bonds, gold, and global equities offer average annual returns ranging from 2% to 11%, well below bitcoin’s three-year average returns.
As seen in the table above, it is in the case of 5-year compound growth that the situation is least favorable for bitcoin. However, the pioneer cryptocurrency shows a CAGR of 8.7%, closely followed by gold with 7% and equities with 6.1%. In this time frame, debt bonds offer a negative return.
Bitcoin price corrections since 2011
The report also addresses bitcoin’s significant price declines and states that the steepest deterioration since the all-time high in November 2021 occurred in November 2022. At that time, BTC reached a low of $15,800, representing a price decline of 76.7% from the November 2021 peak, which was very close to $69,000.
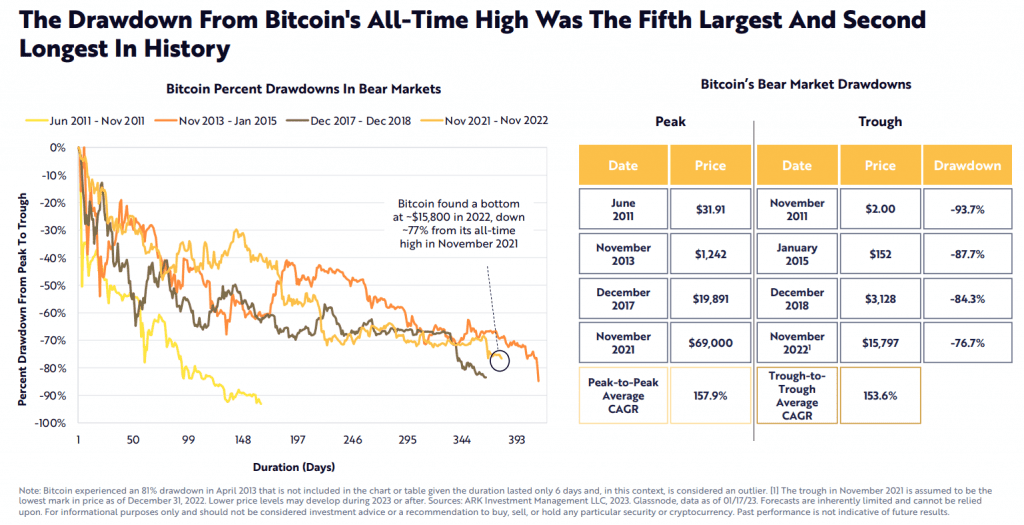
The chart above compares the most significant bitcoin price reversals since 2011. The price drop between November 2021 and November 2022 ranks fourth in the magnitude of depreciation. This correction is the second longest-lasting correction, behind the one in 2013. Ark excludes the April 2013 correction, 81%, as it argues that it lasted only six days.
The table on the right-hand side aggregates the compound growth rate (CAGR) between the all-time highs of 2011 and 2021, which is 157.9%. The compound growth rate between the lows reached in 2011 and 2022 is also very similar at 153.6%. Bitcoin has been in sideways movements around $23,000 in the last two weeks, failing to overcome resistance at $24,000. Bitcoin trades at $22,759, representing a year-to-date appreciation of 38%.