
How would you measure the level of decentralization of a blockchain?
The Nakamoto Coefficient represents the number of validators or nodes that must agree to affect the blockchain and prevent it from functioning correctly. A bigger value relative to the total number of validators, the lower the risk of something like this happening and, therefore, the more decentralized the network.
But not all networks work the same. For example, if a network has many nodes but few validators, it is more centralized than another with the same number of nodes.
Proposed in 2017 by Balaji S. Srinivasan, a former CTO of Coinbase and General Partner at Andreessen Horowitz, this is a way to measure the decentralization of a blockchain. The goal is for the coefficient to manage a measure of how decentralized a network is. The idea is to determine how changes will impact it and make it easier to optimize the consensus algorithms.
As each system consists of subsystems, you can make assumptions about the network’s decentralization level by determining how many entities in each subsystem are needed to control the overall design. The greater the number, and thus the more difficult to control, the more decentralized it is.
Contents
The Lorenz Curve
People use concepts from economics, such as the Lorenz Curve and the Gini coefficient, to calculate the Nakamoto Coefficient. The Lorenz Curve measures societal inequality, which you can extrapolate here to discuss centralization.
When wealth is unequally distributed, this usually implies that it is centralized in the hands of a few. This curve shows the cumulative share of income of different population sectors. The graph will show a 45-degree line connecting the x and y axes if equality is perfect.
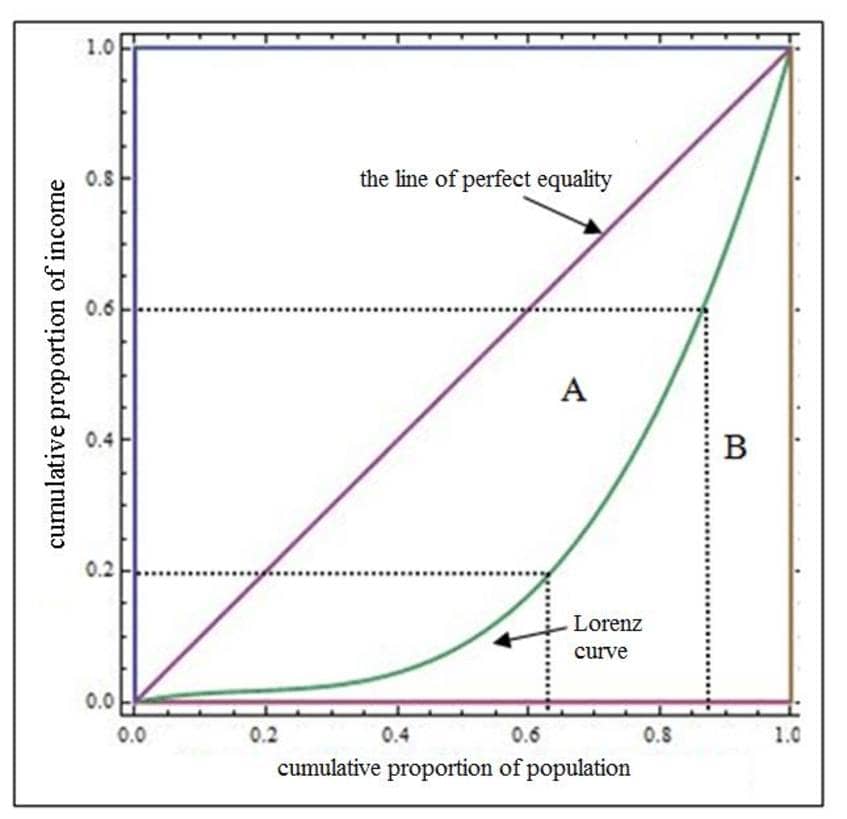
The example in the graph shows how the poorest 20% of the population earns 5% of the income. Compare this figure to the 10% of the people making 45% of the revenue. When the curve is closer to the line of equality, the distribution is said to be equally distributed. Economists use this curve to calculate the Gini coefficient, a popular measure of an unequal society.
Leaving aside whether or not this has any benefit in economic terms (as this metric has many critics), it does seem to have an application for calculating decentralization. Since if we have a group of system entities controlling a large proportion of the network, then we can say that it is a highly centralized system.
How to calculate the Nakamoto Coefficient
The Nakamoto coefficient combines the idea of the Gini coefficient with the concept of subsystems. Thus answering the question of how many entities are needed to control the entire network. For that, Balaji proposed six different subsystems to measure the decentralization in a blockchain network:
- Mining (by reward)
- Client (per code base)
- Developers (by software commits)
- Exchanges (by trading volume)
- Nodes (by number)
- Ownership (by address)
The line separating a healthy decentralized system from one that is not is generally put at 51%. This number may differ depending on the subsystem. When mining on a Proof of Work (PoW) blockchain, the consensus implies that anyone with 51% of the computational power controls the network to double-spend and change the chain course. You can find this problem at a higher level in the case of exchanges. Enough to worsen the liquidity of the system and thus compromise it.
Let’s look at some examples of subsystems.
Mining and Staking
We can look at the Bitcoin hash rate distribution graph to see how the ratio interacts with mining.
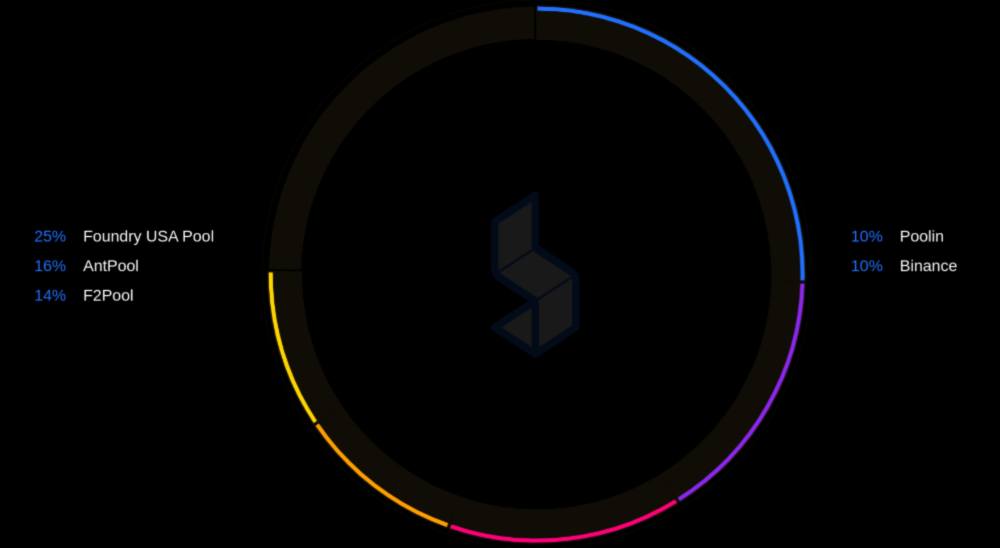
To compromise the system, you must control more than 51% of the subsystem, which is the mining power. According to the distribution of the graph, at least three mining pools must collude with each other to compromise the network, determining that the Nakamoto coefficient for Bitcoin is 4. In the case of Ethereum, this number is also three at the time of writing.
The calculation is different if we want to calculate this on a blockchain that uses Proof of Stake (PoS). To begin with, you have to control only 33% of the staking. For example, in the case of Solana, it would be 19 validator nodes, a higher ratio than Bitcoin and Ethereum, and this crypto is more decentralized.
However, the PoW of these networks seems more liquid than the staked assets. During an attack, miners could stop working on those pools to remove hashing power, which would take much longer in Solana.
Ownership
Another interesting statistic of decentralization is the ownership of these assets measured by addresses. Ideally, a decentralized network is one where no one entity has enough power to influence it using its cryptocurrencies.
However, we have seen how whales are not rare in this ecosystem. And the more cryptocurrencies or tokens these whales have, the less decentralized their distribution and network.
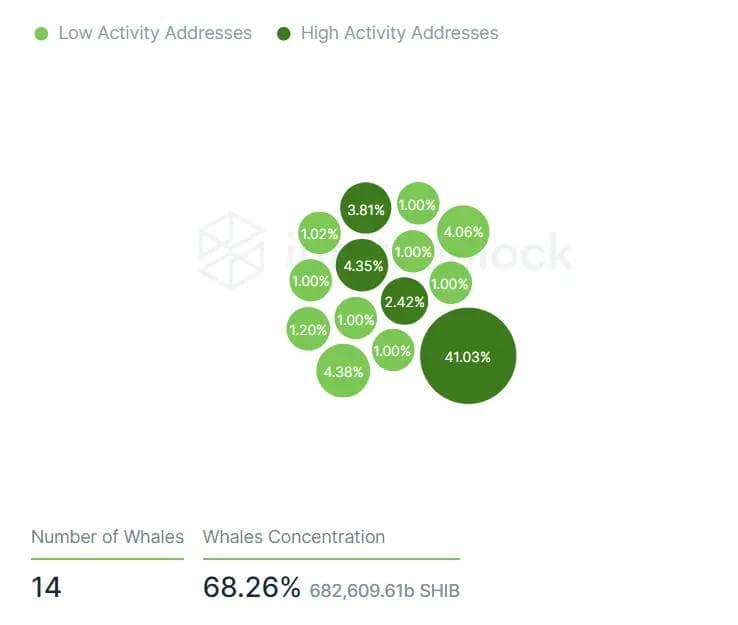
In the case of Shiba Inu, we see how 14 wallets hold 68% of the total supply (as of this writing). Since only one direction has more than 40%, 4 of them gather more than 50%, creating problems for the rest of the investors, as they are at the mercy of these, so we can expect the Nakamoto coefficient to be at a low value. In particular, the SHIB is 4.
Although this metric also has its problems since a whale could have many addresses with small amounts and go unnoticed, giving a good coefficient value but hiding the centralization behind it.
That is why it is always best to use several metrics to reach a value that analyzes the blockchain from several dimensions. And is that so far, we have seen relatively low coefficients, being that in reality, people look for this value to reach at least five digits if we want to talk about a highly decentralized protocol.
Nakamoto coefficient for popular blockchains
Below is a table with the coefficient calculation for some popular blockchains. This number may have changed when you read it, but it serves to get an idea. Note that we don’t list Ethereum here because the total number of nodes in the network is impossible to determine. However, there are some estimates in academic studies.